Logi Analytics has good support for rendering data on google maps however the documentation is very biased to using KML or GPX files. In this post we’ll walk through using a SQL data layer to render regions with a data point on the google map. I assume you have SQL Server 2008 R2 or newer. If you don’t the post is still relevant but the specific commands might not work.
Get your shape file
- Download tl_2013_us_state.zip
- Unzip this files to c:\spatial\states.
You should now have these files:
c:\spatial\states\tl_2013_us_state.dbf c:\spatial\states\tl_2013_us_state.prj c:\spatial\states\tl_2013_us_state.shp c:\spatial\states\tl_2013_us_state.shp.xml c:\spatial\states\tl_2013_us_state.shx
NOTE: The US Census Bureau has some great data here.
Load your data into SQL
-
Download Shape2Sql from here: http://www.sharpgis.net/page/SQL-Server-2008-Spatial-Tools.aspx
-
Extract the zipfile to c:\spatial\shape2sql
-
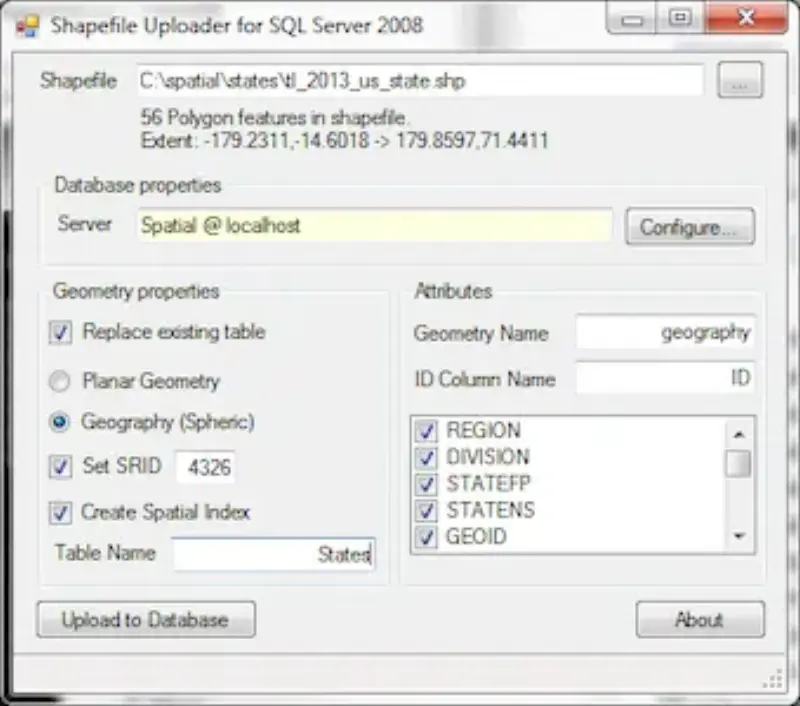
Run Shape2Sql.exe and do the following:
- Choose the states shape file tl_2013_us_state.shp
- Choose your desired SQL server and database (I created a DB named “Spatial”)
- Ensure “Replace existing table” is checked
- Change the radio button from “Planar Geometry” to “Geography (Spheric)”
- Select “Set SRID” with “4326
- Ensure “Create Spatial Index” is selected
- Change the Table Name to “States”
- Change Geometry Name to “geography”
The window should now look like this:
-
Click “Upload to Database” - a progress bar will appear at the bottom of the window and 56 (when I ran it) geographies will be uploaded.
You should have 56 rows of data in the States table. Go check!
select * from States
A little rant…
Here’s where Logi should be picking up the slack. At this point I have spatial data loaded in SQL. Why can’t Logi just use this directly?
But alas it can’t. In fact it needs the data in a very specific format. The SQL data layer needs to have a column named “rdCoordinates”. This column should contain a single polygon in the format: “long,lat long,lat long,lat…”
For example:
-81.044288,39.536612 -81.044385,39.536546 -81.044674,39.536399 -81.044902,39.5363 -81.045345,39.535925…
But go look at our States..geography column - it is not a string. Well … maybe we can use the STAsText() function? Let’s find out …
select geography.STAsText() from States
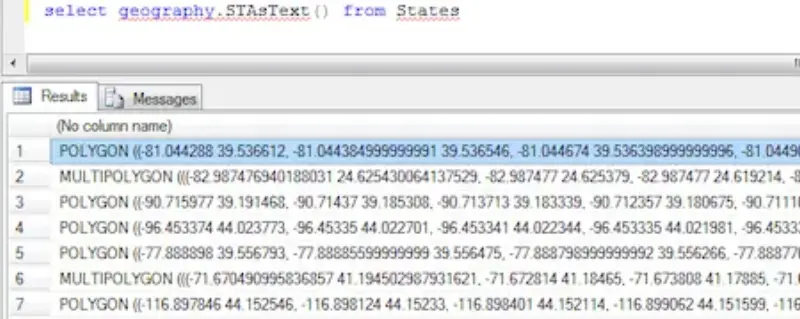
There are two types of results:
POLYGON ((-81.044288 39.536612, -81.044384999999991 39.536546, ...
MULTIPOLYGON (((-82.987476940188031 24.625430064137529, -82.987477 24.625379, ...
This is not the appropriate format and, key point, there are two types of data here.
- A POLYGON is a bounding shape. Think of a state like Nevada.
- A MULTIPOLYGON is multiple bounding shapes. Think of a state like Hawaii (lots of little islands, each their own polygon).
Making Logi happy
To get the data in a form that makes Logi happy, let’s state by creating a new SQL table named StateCache. It has the following definition:
create table StateCache (
    id int identity(1,1) not null constraint PK_StateCache primary key,
    state_id int not null constraint FK_StateCache_States references states(id),
    rdCoordinates nvarchar(max)
)
Please notice the FK to the States table and that I named the column rdCoordinates.
Now we need to convert the States..geography data into the Logi-compatible format. I choose to write a little C# code to do this. I’m running it in LinqPAD. If you use C# and don’t use LinqPAD … now is your time to check it out.
I connect LinqPAD to SQL using this connection definition:
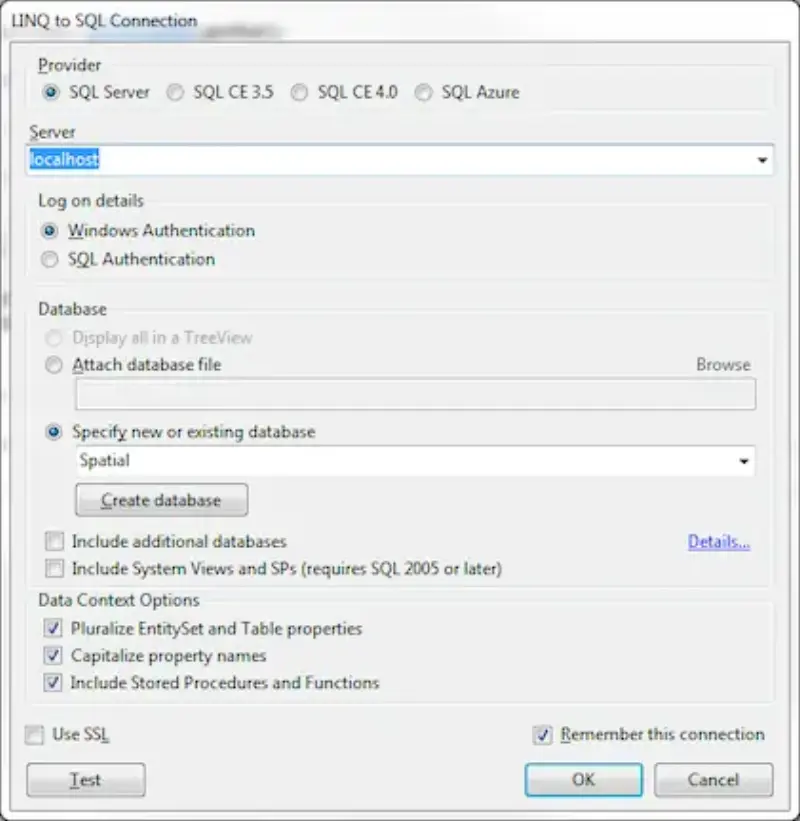
(SQL Server provider, Windows Authentication, Spatial database, all other defaults)
Make sure you set Language to “C# Statements” (which is not the default!)
The C# code is this:
var allStates = from s in States select s.ID;
var cachedStates = from s in StateCaches select s.State_id;
var toProcessStates = allStates.Except(cachedStates);

foreach(var id in toProcessStates)
{
  var multiGeo = (from s in States where s.ID == id select s.Geography).FirstOrDefault();

  for(int geoNum = 1; geoNum <= multiGeo.STNumGeometries(); geoNum++)
  {
    var geography = multiGeo.STGeometryN(geoNum);
    if(geography != null)
    {
        int points = (int)geography.STNumPoints();
        if(points > 0)
        {
          StringBuilder kml = new StringBuilder(points * 25);
          for(int i = 1; i <= points; i++)
          {
            var point = geography.STPointN(i);
            kml.AppendFormat("{0},{1} ", point.Long, point.Lat);
          }

        var row = new StateCache
        {
          State_id = id,
          RdCoordinates = kml.ToString(),
        };

        StateCaches.InsertOnSubmit(row);

        SubmitChanges();
      }
    }
  }
}
Basically it is finding all the states that are in the States table that are not already in the StateCache table and then, one by one, converting them to the Logi compatible format.
Remember earlier that whole thing about POLYGON or MULTIPOLYGON? I handle this here by calling STGeometryN to get the number of polygons (ok, it could be something other than a polygon but I know it’s not. I’m not trying to solve the worlds’ problems … just mine). Then, knowing the number of polygons, I enumerate over each one and create the row with a FK back to the state.
After running this code, if you have the same starting data I have, you will have 149 rows in the StateCache table.
Rendering in Logi
With the data created it is time to open Logi Info Studio. I’m using version 11.0.519 (64bit).
- Create a SQL Data Layer named “Spatial” connecting to the Spatial DB you loaded the data into.
- Open the Default report (or create a new one)
- Add a Google Map to the body. Set ID to stateMap and Height and Width to 600
- Add a Google Map Polygons under stateMap. Set ID to statePolygons
- Add a DataLayer.SQL under statePolygons. Set ID to stateSql
- Set stateSql Connection ID to the Spatial connection
- Set stateSql’s Source to “select * from StateCache”
So what did we do there?
We created a Google Map (stateMap) and added a polygon layer to it (statePolygons). We added a SQL data layer under the polygons and are selecting back the id, state_id and rdCoordinates column. This is enough information for Logi to render the regions in Google Maps. Save and hit F5 and your map should look like this:
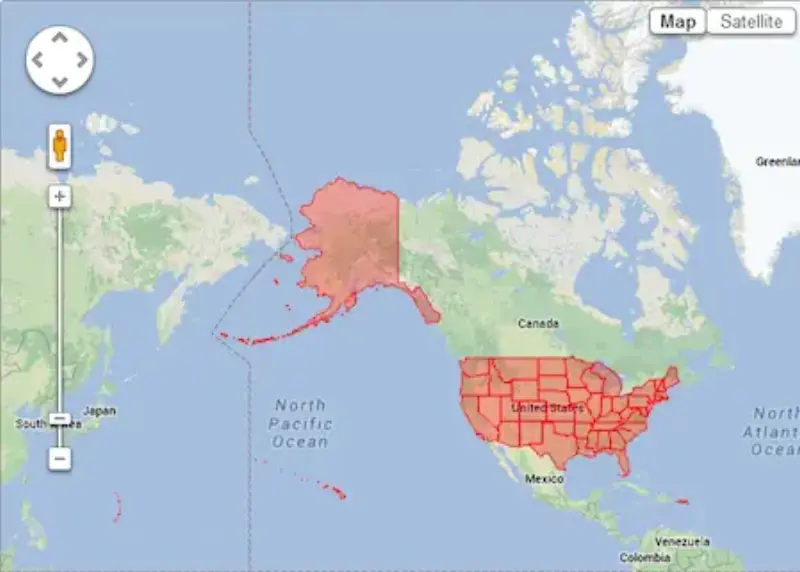
Awesome, right? Now let’s add some colors.
Our query is bringing back not only the coordinates but also a state_id. Ok, this isn’t really a measurement but it is a number that differs for each state so we can use it for distinct colors.
So now let’s do this…
- Add a Color Spectrum Column under stateSql. Set ID to colorSpectrum
- Set colorSpectrum Data Column to “state_id”
- Set colorSpectrum High Value Color to #0000FF
- Set colorSpectrum Low Value Color to #FF0000
- Set statePolygons Fill Color to “@Data.colorSpectrum~” (no quotes)
What we just did was add a color spectrum column to the data source, set the high color to blue and the low color to red and defined the state_id column as the data. This means that state with an ID of 1 would use a red color and a state with ID of 56 would use a blue color. The data here is contrived but it could just as easily been population or sales or whatever.
Save and refresh the browser and now your map should look something like this:
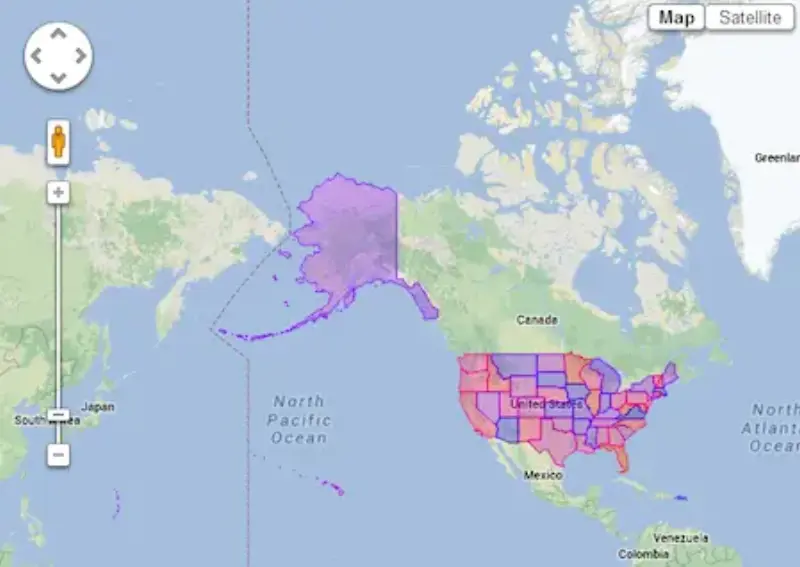
Awesome!
Let me know what you think! If you know a better way or end up using this recipe, I would love to hear it!